Weekly Air Quality Update for Sri Lanka
09 - 15 February 2026
Summary
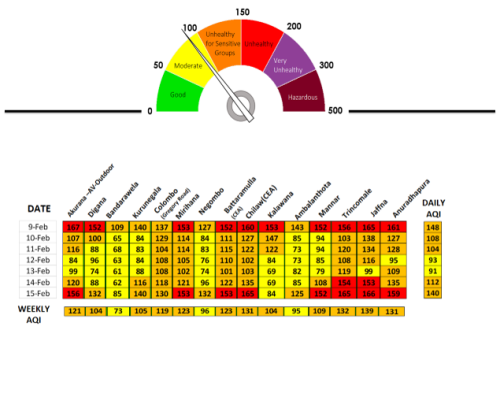
Very poor air quality was seen at both the beginning and the end of last week.
On 9 February, several areas including Akurana, Digana, Mirihana, Battaramulla, Chilaw, Kalawana, Mannar, Trincomalee, Jaffna, and Anuradhapura recorded Unhealthy air quality. On 14 February, Trincomalee and Jaffna again recorded Unhealthy levels. On 15 February, many of the same areas continued to experience Unhealthy air quality, while other places and days showed Unhealthy for Sensitive Groups or Moderate levels.
For the week overall, air quality ranged from Moderate to Unhealthy for Sensitive Groups, with the highest weekly average recorded in Jaffna (139). In general, air quality remained poor throughout the week.
The polluted air mainly came from the north-eastern direction, passing over the Bay of Bengal, with air masses originating from the Indian Sub-continent.
Weekly Air Quality Index (AQI) Levels:
- Unhealthy for Sensitive Groups (AQI 101–150): Akurana-AV-Outdoor, Digana, Kurunegala, Colombo(Gregory’s Road), Mirihana(cleanco), Bandarawela(CEA), Chilaw(CEA), Kalawana, Mannar, Trincomalee, Jaffna, Anuradhapura
- Moderate (AQI 101–150): Bandarawela, Negombo, Ambalantota
Read more about AQ color scale and real-time air quality stations operated by FECT https://fect.lk/air-quality/
Observed fine particulate measurements by the minute for last days


Air Quality impact on human health
Fine particulate matter (PM 2.5) are generally 2.5 microns and smaller in size. Such particles are inhalable and easily lodges inside the lungs reducing capacity. PM2.5 is a concern for people’s health when levels in the air are high. The levels of risk are shown in the dial shown against the US EPA air quality standards. AQ has a scale that run from 0-500, that tells you how clean or polluted your air is. Each level on the scale corresponds to a different level of health concern.