RESEARCH
Impacts of lock down | Horton Plains | Norochcholai
Under this tab provided the case studies in Sri Lanka related to Air Quality. And also provided the case studies regarding the Norochcholai Coal Power Plant, Sampur Coal Power Plant, Horton Plains, Colombo-Impacts of lockdown & Nawalapitiya.
Norochcholai Coal Power PlantNorochcholai Coal Power Plant
Sri Lanka’s first coal-fired thermal power plant and the largest power station is implemented as a venture of Ceylon Electricity Board with the aid of EXIM Bank of the Republic of China. Located 100m inland from the shoreline, the construction was undertaken by the CMEC (China Machinery Engineering Corporation) and the total estimated cost of the project was USD 1.35 billion. The contract for the project was signed in 2006 and the first phase of the power plant, 300 MW was commissioned in 2011. The second phase completed adding another 300 MW in 2014 while the third phase added another 300 MW, making the total power generated through the Norochcholai power plant 900 MW. The first phase also included the construction of a 115km transmission line that connected the power plant to the national grid through the Veyangoda substation. A jetty that extended 4.2km into the ocean was also constructed. Nearby villages include Narakkalli and Penaiyadi on the Kalpitiya peninsula.
Environmental Impact Assessment for NCPP
The Environmental Impact Assessment process itself has several shortcomings – which also contributes to the burdens on people and the environment. This includes a failure to mandate permissible impact due to multiple industries in the same locality and polluting plants that are operated for a very long time.
There have been many unplanned shutdowns and failures far more than would normally be the case. At NCPP, there is no monitoring of the impacts of unplanned shutdowns and start-ups by the regulators.
After the plant was constructed there should have been reports on how well the EIA had captured the impacts. the monitoring as required by the EIA during its subsequent operations were not followed outside the plant.
These shortcomings were pointed out by among others the first author in 2002 (Zubair, 2002) based on his work as an EIA trainer at the National EIA training programs conducted by the Centre for Environmental Studies at the University of Peradeniya.
Air Quality Monitoring Around Puttalam
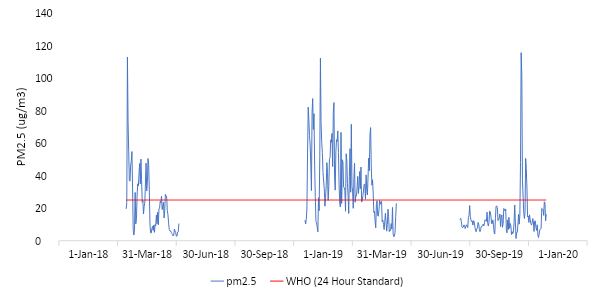
After understanding the shortfalls in environmental compliance of continuous site-specific measurements, installed an instrument to measure airborne fine particulates (pm2.5 and pm10) every few minutes in the village of Narakkali which is to the West of the power plant.
Initially, we installed the instruments in a sheltered location and were able to obtain readings from March to April of 2018. Thereafter, the instrument was moved to a location which was better exposed and it broke down. The dust in the instrument electronics was visible.
The data from the March to April period showed that the village was exposed (even indoors) at levels exceeding the national standards.
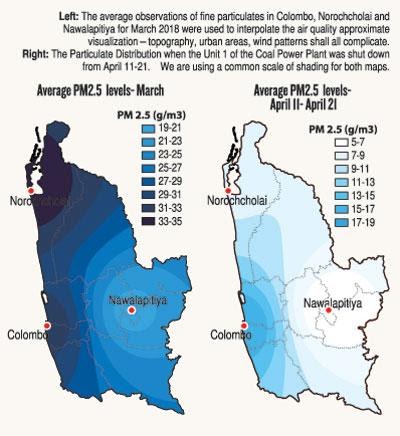
During March of 2018, it was reported that the Electro-Static Precipitator (ESP) Unit was partially dysfunctional. Unit 1 of the plant was shut down to repair the ESP from April 11-21 official and the readings show a dramatic drop from April 8 to 21st. This drop shows that the NCPP is the dominant driver of local air pollution during that period.
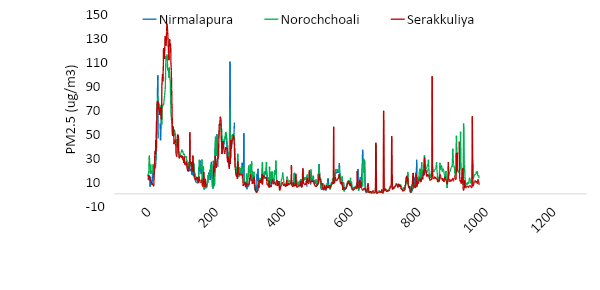
In 2019, we installed four more instruments to the North (Illanthandiya/Norochcholai town and Serrakuliya) and South of the NCPP (Nirmalapura) and further West across the lagoon in Puttalam town and to the South-East in Kurunegala. We have been able to obtain data for some months so far. There is some consistency between the measurements in Puttalam thus giving us confidence in our measurements. Figure 2 shows the comparison in the recent periods for neighboring locations – Nirmalapura, Illanthandiya, Serrakuliya – for the latter months of 2019. Here too the permissible pollution levels were exceeded during some periods.
We have also installed weather stations across the region to better interpret the transport of air pollution.
Transport of Air Pollution to the Western Hills from March to April 2018
The initial EIA had not anticipated serious pollution from the NCPP further afield than 10 km. The second EIA did not look for it either. The measurements described below confirms that there was serious pollution at least 60 km reaching the Western Hill slopes and the coastal areas from March to April 2018.
During 2018, we had undertaken measurements at a remote and pristine hill top in a Nawalapitiya Queensberry tea estate and in Colombo-7 parallel to our observations. To our surprise, we found that Nawalapitiya readings tracked closely with that of Narakkali in March and April of 2018.
When the Unit 1 of the plant with the partially dysfunctional Electro-Static Precipitator Units was shut down, the Nawalapitiya air quality improved immediately. Statistical analysis showed that the relationship between Norochcholai and Nawalapitiya was robust and significant. The analysis confirmed that the air pollution was reaching Nawalapitiya from Norochcholai and not Colombo.
However, there was a weaker relationship between Norochcholai and Colombo air quality. The air quality in Colombo too was getting affected by Norochcholai – however, it did not track as closely. This could be due to the compounding effect of multiple sources of pollution in Colombo and the wind direction during March and April.

We examined the wind directions and speeds in the March to April period using wind measurements in several stations within the triangular region defined by Colombo, Nawalapitiya, Norochcholai and found that wind data measured at Kurunegala was representative. These data showed that during March to April 2018, pollutants were more likely to be transported South-East to Nawalapitiya more than in the Southerly direction to Colombo.

This work was accepted for presentation at the Air Quality in South Asia panel of the American Geophysical Union after peer review in December 2018.
We have found that high-altitude regions are affected by pollution from NCPP in March and April. High-altitude pollution which affects the local cloud systems can be far more disruptive due to impacts on cloud processes. Not only is there likely to impact on the quantity of rain but it shall also lead to the likelihood of acid rain – which also has serious implications for the ecosystem.
While our work was specific for Nawalapitiya, there is likely to be pollution fallout in Kandy, Kurunegala and Kegalla districts which are in the general directions of air pollution transport. This was not anticipated in the EIA.
Transport of Air Pollution to West Coast from November 2018 to February 2019
We found that the pollution reaching Colombo during the period from November 15, 2018, to February 2019 from Norochcholai had a robust statistical relationship. The daily pollution levels for Colombo and Norochcholai are shown in Figure 1.

The transport of wind from Norochcholai was supported by interpreting the windroses and the cumulative transport known as “pollution roses” – this is estimated by taking both wind observations and pollution observations into consideration.
The pollution roses shown in (Figure 2) shows that there is a small but significant fraction of wind being transported toward Colombo.
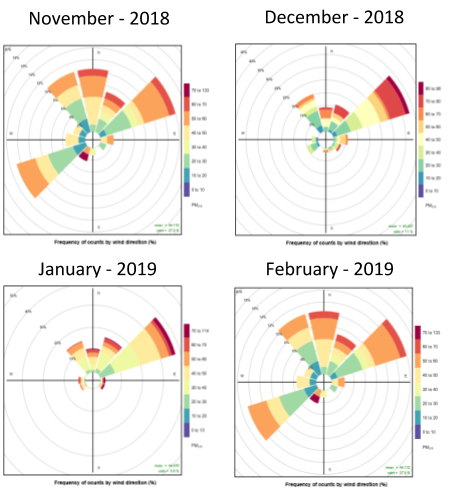
The transport of air pollution from NCPP as far afield as the populated districts of Gampaha and Colombo was not anticipated by the EIA reports. There is no monitoring or tracking in place to detect such pollution.
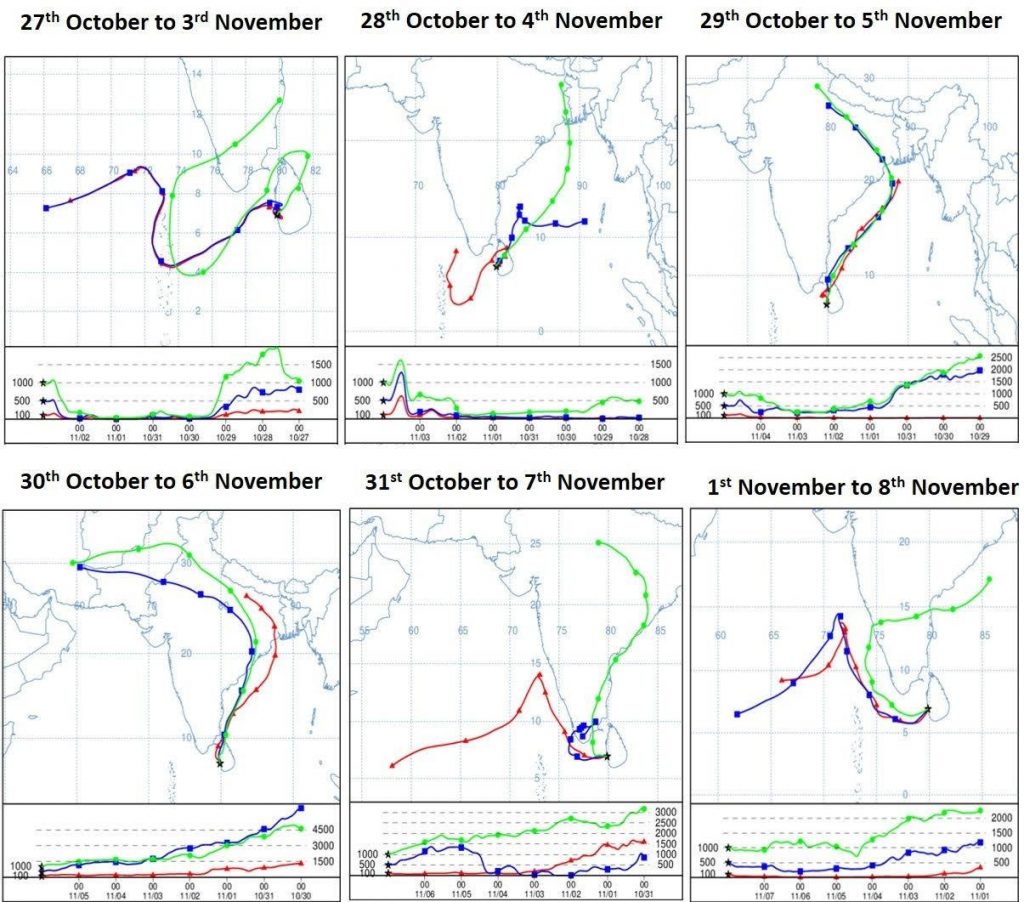
Transport of Air Pollution from Indian Sub-Continent (November 7-9, 2019)
Not all air pollution spikes are due to malfunctioning of the NCPP. For example, there was a dramatic rise in Air Pollution over most of Sri Lanka from November 7-9, 2019 that can be attributed to the transport of air pollution from Northern India.
Air pollution in Sri Lanka is much lower than the Northern Indian cities. However, pollution levels are on the rise in Sri Lanka.
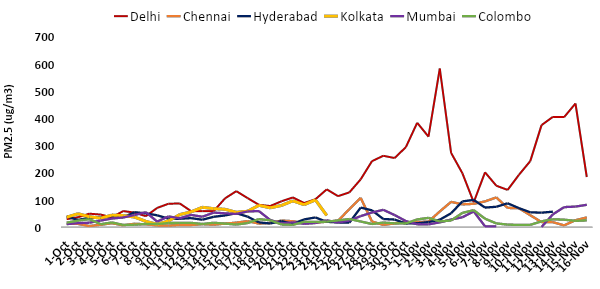
Our source detection work – where we use a history of observed wind data and observations at Colombo – to construct back trajectories shows that recent dramatic rise in air pollution had contributions from Northern India – in particular New Delhi.
Such pollution from India too needs to be considered more seriously. But for the most part, air pollution is locally sourced.
This figure shows that the air pollution from New Delhi and Kolkata reached Sri Lanka through the Bay of Bengal on a couple of days. On these days, the pollution spiked not only in Colombo but also in Puttalam and Kandy in Sri Lanka.
Sampur Coal Power Plant
Sri Lanka’s second coal fired thermal power plant is implemented as a joint venture of Ceylon Electricity Board and National Thermal Power Corporation (NTPC) of India. The Joint Venture Company has been incorporated as Trincomalee Power Company Limited on 6th September 2011. Trincomalee Power Company Limited is responsible for implementation and operation of the 2 X 250MW coal power plant in Sampur. The total estimated cost of the project would be USD 512 Million. The Sampoor Coal Power Plant will comprise two 250 MW power generators. The power generated will be transmitted to the national grid through high voltage transmission lines from Sampoor through Habarana to the Veyangoda Grid Substations. Power Purchase Agreement, Implementation Agreement, BOI Agreement, Land Lease Agreement and Coal Supply Agreement were signed on 07 October 2013 by relevant parties including GOSL, CEB and JV Company. Project is expected to be commissioned before end of 2017.
Project Details
- Sponsor: Trincomalee Power Company
- Parent: Joint venture between Ceylon Electricity Board and NTPC
- Location: Sampur, Trincomalee district
- Coordinates: 8.486111, 81.3 (exact)
- Status: Permitted (Units 1-2); Pre-permit development (Units 3-4); Announced (Units 5-6)
- Gross Capacity: 500 MW (Units 1&2: 250 MW), with possible extension by an additional 2×250 MW and 2×300 MW
- Type:
- Projected in service: 2017
- Coal Type:
- Coal Source:
- Source of financing: India and/or Japan International Cooperation Agency
Is the air pollution analysis for the Sampur Coal Plant credible? Where does the wind take pollutants from Sampur?
As per modern myth, school texts, and national atlases, the wind blows from the North-East over Sri Lanka at
the turn of the calendar year. Even the birds know it. The transcontinental migrants draft on the North-Easterly winds to steer to Hambantota for the Siberian winters. However, the analysis of atmospheric pollution in the Environmental Impact Assessment (EIA) for the coal-burning power plant proposed at Sampur presumes that the wind blows from the South-East.
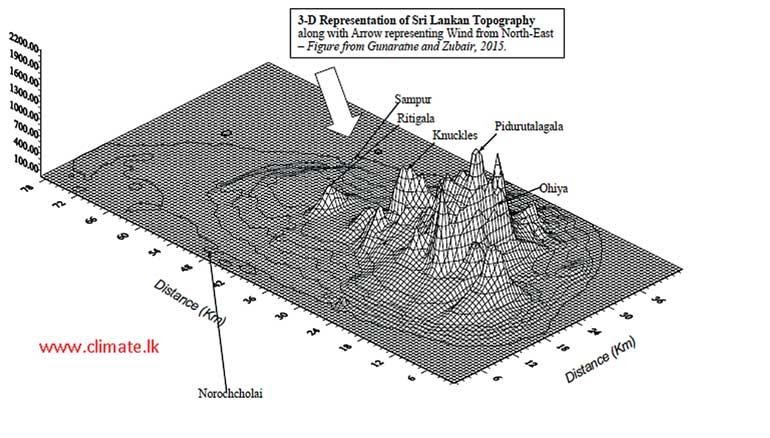
If the wind is from the North-East, it shall entrain the pollutants from Sampur towards the central mountain ranges from Ritigala to Namunukula. Mountains amplify the impacts of pollutants on atmospheric chemistry and cloud physics. Even a modest rise in toxic gases can have damaging consequences on the air people and animals breathe, the water they drinks, and ecosystems. This can impact the quality of tea and hydropower production.
Coal burning power plants release dust and pollutants and toxins such as Mercury into the atmosphere. Every year, the Sampur plant is projected to vent 10,000 tons of sulphur dioxide, 10,000 tons of nitrous dioxide, 1,700 tons of other particulate matter and other toxins and four million tons of carbon dioxide. These are monumental quantities that cry out for serious attention.
To show that this is safe, the EIA consultants from New Delhi, Mantec Ltd., rely on a computer model which tries to mimic the venting of these chemicals into the atmosphere. Such computer models are built on crude generalisations and shaky assumptions. To mitigate the shortcomings, all available data should be used after careful quality control and the results should be cross-examined.
The wind over Sri Lanka from December to February
Mantec relies on one year of observations by CEB at Sampur and another month of their own measurements. This is a hundredth of the wind observation that is available. It may be that the CEB instruments observed something extraordinary over Sampur in after December 2012. This possibility should be entertained after cross-checking the data against observations in the neighbourhood.
Usually, when one undertakes environmental observations in a new site, stringent checks should be undertaken. Often there are instrument errors, calibration errors or simply misalignment or errors in recording data. No reports on quality control have been presented. The windrose shown is consistent with the Mantec finding that the wind from December to February comes largely from the South-East.
The wind directions for December to February that Mantec has presented are at odds with measurements from the Department of Meteorology, the Air Force, by the Ceylon Electricity Board (CEB) elsewhere and our own institute in Kandy. Satellite wind observations and climate model simulations too present North-Easterly flows. There are dozens of research papers to confirm this.
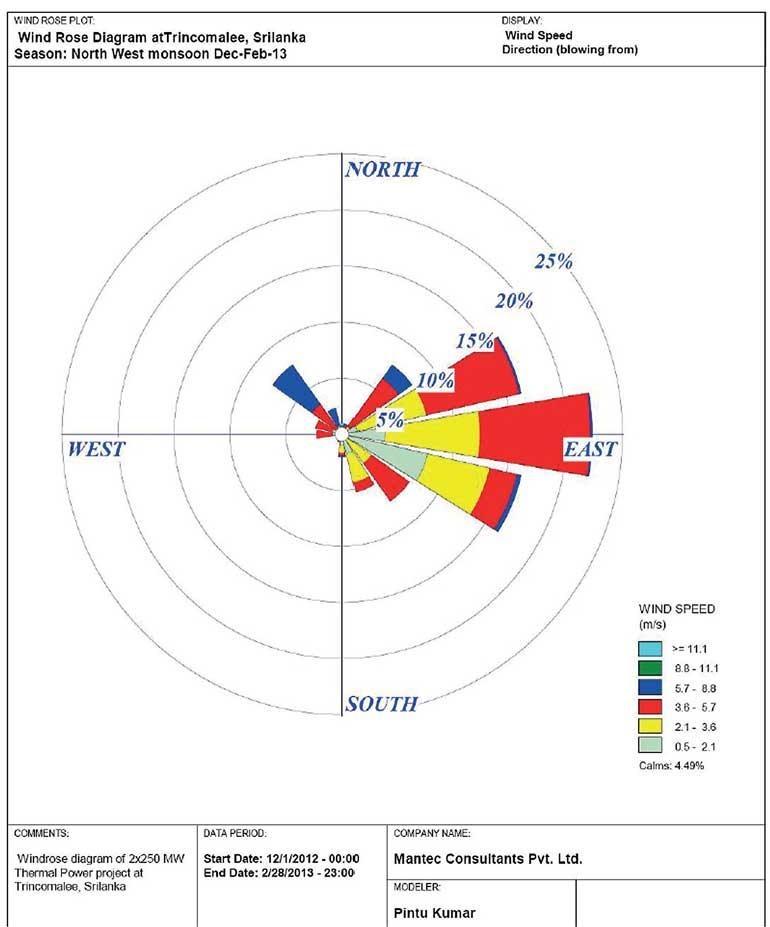
The ‘Windrose’ is a representation of which direction the wind comes from for December 2012 to February 2013. The distribution of wind speeds from each direction is shown in colour – Courtesy: Sampur EIA from Mantec.
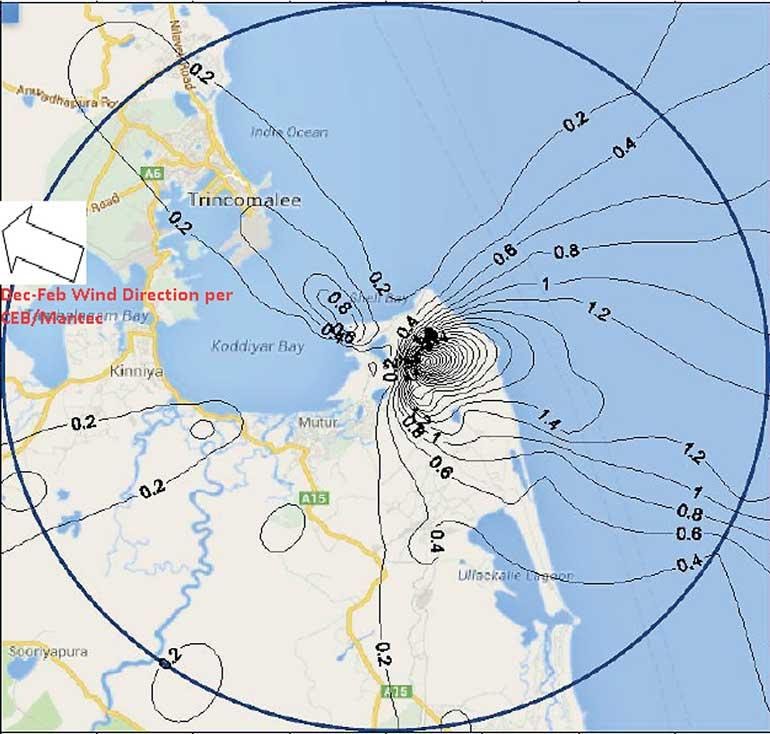
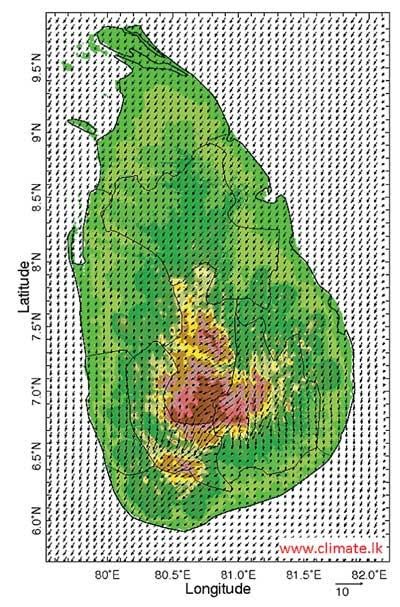
Nitrous oxide pollution for Dec-Feb period as estimated by Mantec: The contours show the peak concentration of nitrous oxides for a day due to the emissions. We inset an arrow to show the South-Easterly wind direction that the wind comes from according to the EIA. Notice, the contours with higher concentration is drawn towards the South-East – Source: Mantec EIA Report.
Assumptions and generalisations regarding wind and air pollution in the EIA
There are other causes for concern. Mantec has made the following inter-locking assumptions and generalisations:
(a) The wind measurements in Sampur represents the wind across the East: A better accounting of regional variation in the wind is needed. There are variations due to location, storms, mountains and sea breeze. The sea-breeze and the desiccating mountain slope winds (“kachchan kaththa” in Tamil) that affects Sampur in a particular way.
(b) Wind observations at Sampur can be extrapolated to higher elevations: The CEB instrument does not reach the high elevations that the pollutants travel to. It is hard to capture the wind profile at higher elevations without observations. The assumptions in the software about the upper air should have been verified for our specific equatorial geography.
(c) One year of wind observations is enough: The wind varies substantially from year to year variation of wind in Sri Lanka. For example, in some years there are storms and even cyclones. In other years, the El Nino alters the wind flow. One just cannot use just one year of data to project for the next half-century if serious.
(d) The past can represent the future: With decadal and climate change (which we have documented for Sri Lanka), one cannot assume that the past represents the future. The EIA does not address the risks posed by climate change such as more frequent intense rainfall, cyclones, sea-level rise or changing wind and storm patterns all of it of relevance for Trincomalee.
These shortcomings could have been mitigated by making use of all available data, consulting past research, addressing inconsistencies and communicating what risks this analysis has not addressed.
Pollution concentrations on the ground according to the EIA
Anyway based on these data and assumptions, the Mantec model estimates dispersion of dust, nitrous oxides, sulphurous oxides and particulate matter under idealised conditions. For example, there are no plant breakdowns or accidental large releases. Essentially the model projects how much of the dust shall settle in the region surrounding the power plant. They limit their analysis to 20 km. The wind data for December to February largely blows from in-between the East and South-East.
The output from the Mantec model perplexes – for example, in the December to February period, the pollutants are carried towards the South-East and into the sea. In other words, the pollutants go against the wind. Nowhere on the earth’s surface is passive matter known to go against the wind.
In an attempt to validate the Mantec model results, the Industrial Technology Institute was contracted by Mantec to undertake similar simulations. The ITI model too relies on similar assumptions and generalisations. They too use only one year of wind data albeit from a climate model run in the US. Not enough information is given in the EIA for comparison across seasons. However, the patterns of dispersion of pollutants they project is misaligned with that from Mantec and the pollutant concentrations is several times that from Mantec. The EIA does not reconcile the discrepancies.
What can we infer for mountains and the atmosphere above us?
Wind and rainfall in the North-East Monsoon
As the North-Easterlies winds take moist air up the mountain slope, it encounters cooler temperatures. As it cools, the water vapour in the air condenses into tiny droplets. These droplets form only on tiny impurities that are found even in the pristine air in the East. These droplets keep growing into clouds until they are large enough till they burst and fall as rainfall. This mechanism is what gives us the heaviest rainfall on the eastern slopes of our hills from December to February.
Increase the pollution levels even modestly, and the droplets shall become a mist rather than a rain cloud and pass over the mountains and onwards West. Not only can such slight increases in pollution reduce rainfall, but it can also reduce solar radiation and change evaporation. It can reduce the flow in our eastern streams and disturb the ecosystems from the hills to the eastern coast directly.
Impacts of pollution streams into the mountain slopes
The sulphurous and nitrous oxide emissions along with the heavy metals can lead to toxic rainfall. This can have far-reaching consequences on our climate, the health of humans, ecosystems, water supply, air we breathe, the quality of tea, agriculture, and hydropower generation. The contamination shall be not only on the eastern mountain slopes but be carried to the eastern slopes and over the mountains.
Two decades back, Prof. Oliver Illepurama’s research group undertook studies in Kandy and reported that air pollution levels for some of the gases released at Sampur were hazardous – things have only got worse since. Thus in Kandy, the only place we have data, we see a need to check the additional risk from Sampur.
Learning from other coal plants
The surroundings of the Norochcholai Power Plant are covered in dust, particularly when the wind blows from the South-West. No Government body monitors and reports on it. And one can only describe this as wilful and convenient blindness by the State.
As poorly anticipated, monitored and mitigated as the air pollution at Norochcholai is, the consequences at Sampur can be worse. The wind field and topography is such that the pollutants from Norochcholai are entrained away from our mountains but not that from Sampur.
Some argue that combustion technology and air scrubbing system is more advanced at Sampur Power Plant. This assurance needs to be taken with caution. A model “clean technology” coal power plant was installed 3 years ago in Mississippi, the USA in much more advantageous circumstances, and despite all the promises and state support, it has only left massive pollution far beyond the projections (New York Times, 5 July).
Credibility of the air pollution analysis
When anyone proposes to experiment with our atmosphere by injecting millions of tonnes of chemicals for multiple decades, we should take extraordinary care. We must have air pollution projections which are transparently done, are scientifically defensible, and undertaken with integrity, technical competence and professionalism. The results should be presented openly and reviewed independently and widely including to those directly affected.
By using air pollution models which are limited by design in what it can anticipate, by using input data that are suspect, by not consulting what is already known, by providing no credible validation, and limiting the checks to pollution levels at the ground alone, the EIA process for the coal plants has not credibly addressed the danger ahead.
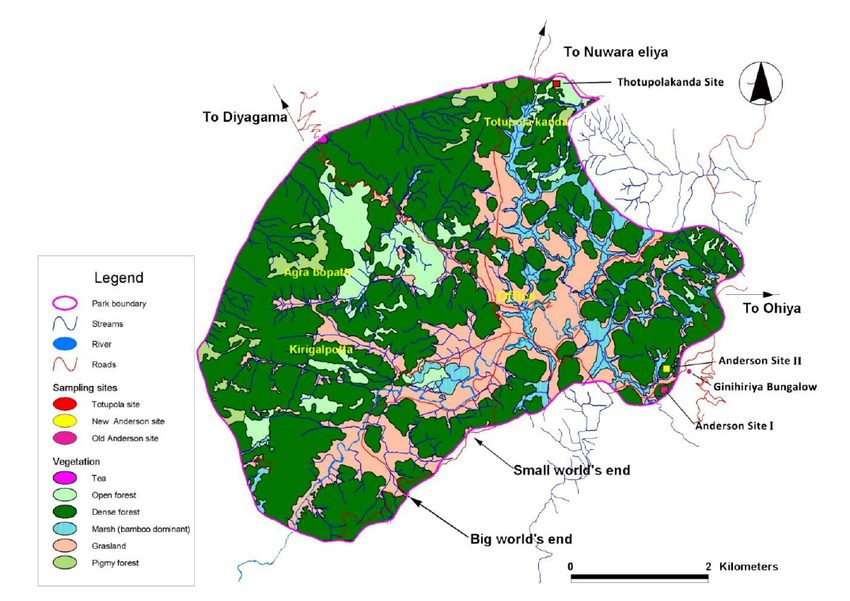
Understanding the relationship between AP/AQ, Pb, and forest dieback in HP is a first step in involving the scientific community and the greater community to find solutions to preserve this important and sensitive, natural upper montane forest
Skeletons of dead and dying large trees have become a common feature of most of the area in Horton Plains (HP), an upper montane forest in Sri Lanka, which is a highland natural forest and a water catchment at the head of three major rivers. The untimely death of trees and destruction of the natural forest vegetation has brought massive destruction to this important natural resource. Multiple tree deaths, where the trees usually lose their foliage from top-down without displaying any obvious sign of physical disturbance, fungal disease, or insect attack, were first observed in Thotupolakanda and was reported in 1978. Researchers further clarified that these patches were observed on the windswept western slopes and ridges with shallow soils. By the year 1999, it was found that about 17.2% (654.3 ha) of forest areas in HP are subject to dieback, with more than 75% of the canopy trees either dead or dying, and the remaining trees showing signs of degeneration, on Thotupolakanda and Kirigalpotta areas, making the case more severe, and also noted that the plants on the wind-exposed areas are more susceptible to die back than the plants on the wind-covered sites. Previous studies have precisely identified two of the key causes for the destructive forest die-back in HP – i.e. Cadmium (Cd) and Lead (Pb) in the forest soil, with more emphasis on Pb as the level of Pb found in soil is higher than average, especially in the wind face of the forests where dieback is most acute. Though many researchers point to atmospheric depositions as a culprit, there is no published evidence to support this premise.
Colombo- Impacts of lock down
Reports on Drop in Air Quality Index due to Curfew
News reports, feature articles and social media posts have attributed the recent improvement in air quality to the curfews since March 20. These reports seem to follow news in other locations such as Southern California or in Central China where the pollution had dropped by up to 70%.
The interest in environment and in observations is welcome and hopefully this can lead to greater climate and environmental literacy. However, the casual surmise that if one shuts down traffic and closes down the majority of industries and then we shall have better air quality is a question can set us back as we may misplace the focus on environmental protection activities.
The primary sources of pollution under the curfews were
- Transboundary Pollution particularly from the Indian Sub-Continent
- Forest Fires, Garbage Incineration, Agricultural Residue Burning
- Norochcholai Coal Power Plant
- Industries that continued to function including other thermal plants (Diesel and Heavy Oil Power Plant.
The relative contributions of these sources vary by place and time. Below, we make use of the available observation of air pollution to address some of the questions.
Instrumental Measurements in Sri Lanka

which measures of fine particulates in the Atmosphere) as measured by the US EPA certified instrument in the US Embassy since September 2017
There are a growing number of air pollution measurement stations in Sri Lanka which observe air pollution (fine particulates such as pm1, pm2.5 and pm10, Noxious gases such SOx, NOx, CO, CO2, O3 and heavy metals). Of these, the index called Air Quality Index (AQI) is tied to the number of fine particulates of the size of 2.5 microns (pm2.5) per cubic meter and to other pollutants. The Central Environmental Authority, National Buildings Research Organization (NBRO), US Embassy (USEM), National Institute of Fundamental Studies (NIFS), and our organization (FECT – www.disaster.lk/airquality) measure pm2.5. The Air Quality instrument at the US embassy in Colombo 7 follows the US Environment Protection Agency (EPA) certified methods and is the most reliable instrument in Sri Lanka presently.
If one compares the USEM data for pm2.5 one week before and one week after the curfew (March 20), then there is no perceptible drop. If one compares longer durations before and after (2-4 weeks), there is a drop off amounting to around 30% – significant but not overwhelming.
Often the drop off of pm2.5 between February and April of around 50% is presented as evidence of the dominant role of curfews. However, such a comparison includes the influence of several wind directions in April as well. Even without curfews, there was a similarly large drop off in 2018 and 2019!
A way, to approximately account for seasonality is to compare the values for a particular month with that in the previous years. The chart shows that
- The March pm2.5 has a slight drop in 2020 when compared with that in March 2018 (less than 5%) . This despite the last 10 days of March 2020 being under curfew
- The drop off in April and May for 2020 compared to that in previous years is around 15-30%.
As large drops are seen in previous years without curfews as well, we can attribute the major cause of the drop off due to seasonal change in the wind. The reversal in wind directions in April brings in pollution to Colombo from sources other than traffic and other industries.
From November till March, the wind comes from North and East and includes pollution from transboundary sources and that over Sri Lanka landmass. The transboundary pollution includes contributions from pollution over the Indian Sub-Continent and the Bay of Bengal littoral in Northern Thailand, Burma and Bangladesh. As the air trajectories pass over the Sri Lankan landmass, then it can bring in pollution from Norochcholai coal burning, forest fires, agricultural residue and garbage burning and other functioning industries.
From April to September, the wind reverses so that on average the wind direction is coming from the South and West with the trajectories over the pristine atmosphere of the Indian Ocean. While these are average directions, there is the day to day variability as well that affects the pollution levels.
Variability in Wind Trajectories
We have computed trajectories of air that reaches Colombo on each day before, during and after the curfews. The accompanying maps show such trajectories for the two days with the highest Air Quality Index (AQI) and the two with lowest AQI. These maps and similar others show that it is when the wind comes from North and East then air pollution is twice as high as when it comes from the South and West.
What we find is that the days on which wind come from the North are days in which the pollution is the most. On days in which the air masses arrive from over the more pristine Arabian Sea and Southern Indian Ocean are days with the least AQI.
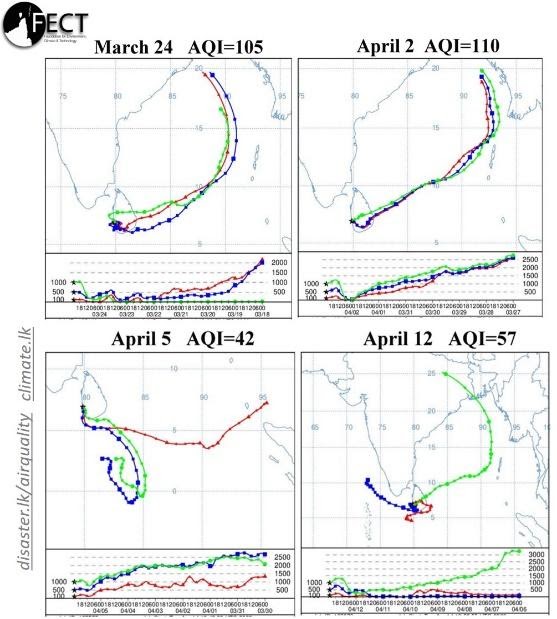
These maps support the larger role of wind transport over just local traffic in Industries during the curfews. The transport of pollution from the land to the North and the fires that burn at Norochcholai Coal Power Plant, our forests, scrublands and agricultural residue and garbage.
Implications
In Sri Lanka, traffic and the shut down industries and activities do contribute significantly to air pollution but it is secondary to the combined effect of other factors the role of which are manifested by the wind reversal in April. These major sources of pollution are:
Transboundary Transport of Pollution:
There is transport of pollution from the Indian sub-continent. The maps shown here are an illustration of such transport. Indeed, the dramatic rise in air pollution in Colombo observed during 3-5 November 2019 were on days where the air pollution levels in Northern India was high and where the air arrived in Sri Lanka from over New Delhi, Kolkata, the Bay of Bengal, and the Western Coast.
Forest, Scrub and Agricultural Residue Burning:
There is a lot of cavalier setting to fire to forests and grassland in March. Setting fire to dry tinder is sometimes a prank and sometimes for short term gain. There is no monitoring and regulations in place and little appreciation of air pollution among other impacts.
Poor solid waste management systems:
Poor solid waste management systems and the availability of cheap cooking gas has resulted in rural and urban dwellers incinerating unnecessarily. There is a sense that sending something into the atmosphere is cost-free waste disposal. The true costs are not known and here too there is room for mitigation.
The Norochcholai Coal Power plant (NCPP):
The Norochcholai Coal Power plant (NCPP) spews 5000 kg each day into our atmosphere when it is running perfectly – on other days with defective air purification equipment or when unscheduled shutdown or startup, it can emit more. The emissions from the NCPP are directed towards the Western Coast and Hills from November to March; the emissions are directed to the North-Western, Central, North-Central, Eastern and Northern Provinces from April to October. There can be much better focus on following the environmental regulations in place.
Coal is the single largest emitter of air pollution and after the gap between the promise of clean coal and the failure to deliver, it will be a blunder to build additional coal plants that shall affect future generations.
Other Functioning Local Industries:
Thermal power plants in Kelanitissa, Sapugaskanda and other places in the vicinity of Colombo were operated at a higher load than is typical despite the drop in demand. Hydropower use was relatively lower.
Even though the air pollution drops in Colombo, from April to September, the wind reversal takes the pollution from Western Sri Lanka to the eastern half. Persuasive studies from the Universities of Peradeniya and Sabragamuwa University that show that the forest dieback in Horton Plains is tied with a rise in pollution from April to October. This are likely be related to the transport of lead in the air from Western Coast.
Summary
The curfews that took place not only Sri Lanka but also in the Southern Asian region contributed to a significant drop in air pollution. However, a single factor explanation does not hold for Sri Lanka as it did for some other regions. The role of curfews was overshadowed by the the bi-annual seasonal reversal in wind as happens in monsoonal regions. To mitigate air pollution in a time where COVID19 threatens our respiratory health, we should not focus only on curfews and a few industries but address other major sources of atmospheric pollution.
Norochcholai ash contaminates Lanka’s western atmosphere
Our instruments indicated that very fine air-borne ash particulates from the Norochcholai Coal Power Plant were reaching the hills of Nawalapitiya and Colombo in March and April last year. We measured particulate matter so fine that it could lodge inside one’s lungs (2.5 micro-metres abbreviated as pm2.5). These particulates will diminish rain-bearing clouds, will be toxic to fauna, coat vegetation and crops, and lop years off the life expectancy of those exposed to them.
These unexpected findings arose from two unrelated lines of inquiry – one on the impact of air pollution on clouds and, the other, on the impact of the Coal Power Plant on its locality.
We installed the instruments in Colombo and Nawalapitiya to assess the impacts. In Colombo, the instruments were placed in Cinnamon Gardens (alongside a certified instrument maintained by the US embassy). The air quality here was primarily affected by traffic. In Nawalapitiya, the instrument was kept on a remote hilltop (the Climate Change Observatory of Dilmah Conservation).
In March last year, Colombo and Nawalapitiya averaged pm2.5 of 30 and 15 micro-grams per cubic metre respectively. By comparison, the national mandated limits for particulates for the annual mean is 25 which is lax compared to the US threshold of 15 and Australia’s 8.
Impact of Norochcholai Plant on neighborhood
In Norochcholai, our instrument was located outside the Coal Power Plant. This plant was inaugurated in 2011 with a 300 MW unit and was subsequently expanded to 900 MW with two additional units. The plant provides up to 50 percent of the electric energy to meet the intensifying wants of the consumers. The maintenance of the plant has been sub-par and the environmental monitoring has not been up to what is required.
Ash and other dust can be carried from the emissions from its three chimneys and from the stacks of ash stored in its yard. This ash can contain toxins such as arsenic and variety of metals. The plant operators monitor emissions within the chimneys well. However, the air quality outside the plant is seldom monitored – maybe as an exercise in ticking off regulatory requirements and in public relations.
On average, 850,000 kg of fly ash is routed to the chimneys via the scrubbers each day – if the scrubbers work well then 90-99 percent may be captured. This amount increases with malfunctions – there have been more than a score of unplanned shutdowns. Even if a modest part of this injection of ash (and other chemicals) is carried by air in a given direction, it can have an extraordinary impact on the ecosystem, wildlife, plants, clouds and humans.
In March last year, our Norochcholai instrument indicated an average monthly pollution (35) higher than Colombo (30). The Norochcholai readings are lower than what the villagers are exposed to as the instrument was kept inside a small building for safety.
Air Quality without the malfunctioning unit?
One of the three power plants had several malfunctioning exhaust air scrubbing units – this plant was shut down from April 11 to 21 last year for repair. The average pollution dropped to around 10 in Norochcholai, to 20 in Colombo and to 5 in Nawalapitiya. The pollution did reduce after the repairs to Unit 1 were completed.
Does Norochcholai Air Pollution reach Nawalapitiya and Colombo?
After stumbling on the finding that the Nawalapitiya, readings dropped abruptly with the Norochcholai Coal Power Plant shutdown, we compared the readings from these locations prior to the shutdown – we found out that their undulations tracked one another closely.
The particulates that are carried by air shall vary by the time and location due to the wind and rain in the locality and beyond. Even with these confounding factors, the chance that the readings at Norochcholai and Nawalapitiya tracked each other due to random chance is less than 0.05 percent. We cannot come up with a viable alternative hypothesis as to why these undulations should be close to lock-step. This is as close as one gets to conclusiveness in this sort of work.
The correlation between observations at Norochcholai and Colombo does not track as clearly to the eye but statistically, the evidence of a relationship is clear and the likelihood of a chance relationship is less than 5 percent.
Colombo has multiple sources of pollution and they camouflage the influence of Norochcholai. Still the evidence is there: with the right wind direction, the Western coast is also affected by the Coal Power Plant emissions –many people in this region are already exposed to high pollution levels.
Our recent analysis, from November 16, 2018 to February 25, 2019, shows that the relationship between measurements in Norochcholai and Colombo is clear to the eye – there is a less than 0.1 percent chance of this being a random correlation.
Why was such long-range pollution transport not anticipated?
The authorities (e.g. The EIA) had not anticipated transport of pollution to the hills and the western coast because of ingrained myths regarding wind patterns. It was presumed the air pollution for the most part would be carried to the sea from December to February and would be carried to the Northern Puttalam and beyond in other months.
Indeed, the EIA for the proposed Sampur Plant showed alarming ignorance about wind – Financial Time, 20 July 2016 – http://www.ft.lk/article/555835/Is-the-air-pollution-analysis-for-the-Sampur-Coal-Plant-credible).
Wind measurements in several locations within this area show that there is a significant fraction of time when the air blows from Puttalam to the Western Hills and Coast. The wind headed to the hills for 8 percent of the day in March last year.
Despite such allowance for environmental or maybe convenient ignorance, we can see that if the air quality monitoring had been undertaken as required by the EIA, then the power company and the regulators would have been clued in long ago.
The pollution in Sri Lanka is lower than the catastrophic levels in urban India and China. Yet, the Central Environment Authority (CEA) and the National Building Research Organization (NBRO) have shown that air pollution is rising inexorably in urban centers, where it is already a health hazard –e.g. Kandy city as shown by Prof. Oliver Ileperuma and others at the University of Peradeniya, NBRO and CEA.
Lessons learned
- We have established that air pollution monitoring is viable at relatively low cost and those entrusted have chosen to operate blindly of the impacts.
- 8,500 kg of ash containing toxins being spewed daily into our atmosphere warrants our attention — even when the plant works as advertised.
- We have established a long-range impact of air pollution from the plant.
- The plant operators, regulators and their overseers fail when the plant is operated with malfunctioning units as was the case in March last year (and probably before).
- The villagers in the vicinity raise the alarm but their voices have been largely ignored. There is a moral failure when we compromise the visible health and economic impacts on the villagers for our comfort. Through this work, we now know that we ignore their alarm, health and future, at our collective peril and that of all beings around us.